Guides · Tools
The best product analytics tools for a small SaaS in 2026
Six analytics tools a small SaaS team actually picks between, what each is best at, what it costs and what it asks of you, so you can choose in ten minutes instead of a week.
Most analytics comparisons are written for companies with a data team. A small SaaS has different questions and less time: where do my users come from, where do they get stuck, who pays, who's about to leave, and what do I do about it this week.
These are the six tools small teams most often choose between, judged on those questions. We make UserJourney, so it's first; every other tool's facts come from its own pricing page and docs, and the side-by-side table links them.
The short answer
| Tool | Best for | Free plan | Paid from |
|---|---|---|---|
| UserJourney | Founders who want answers, not dashboards to build | Up to 250 users | 19 € a month |
| PostHog | Engineering teams who want replays, flags and experiments too | 1M events a month | Per event after that |
| Mixpanel | Product teams with a tracking plan and someone to keep it | 1M events a month | By events |
| Amplitude | Product and data teams at growing companies | 2M events a month | Plus from $0, by events |
| Plausible | Simple, cookieless traffic for a blog or marketing site | 30-day trial | $9 a month |
| Google Analytics | Marketing sites that run Google Ads | Free | Free; 360 for enterprises |
What to look for
Five things decide whether a tool is worth it for a small SaaS:
- Time to the first answer. Can you see where users drop on day one, or do you first write a tracking plan and build the funnel?
- People, not just events. Can you open one user and see what they did, by email?
- Payments. Does revenue come from Stripe or Paddle by itself, matched to each person and channel?
- Privacy. Do you need a cookie banner for your visitors?
- What it does with the answer. Does it stop at a chart, or tell you who needs a word and help you send it?
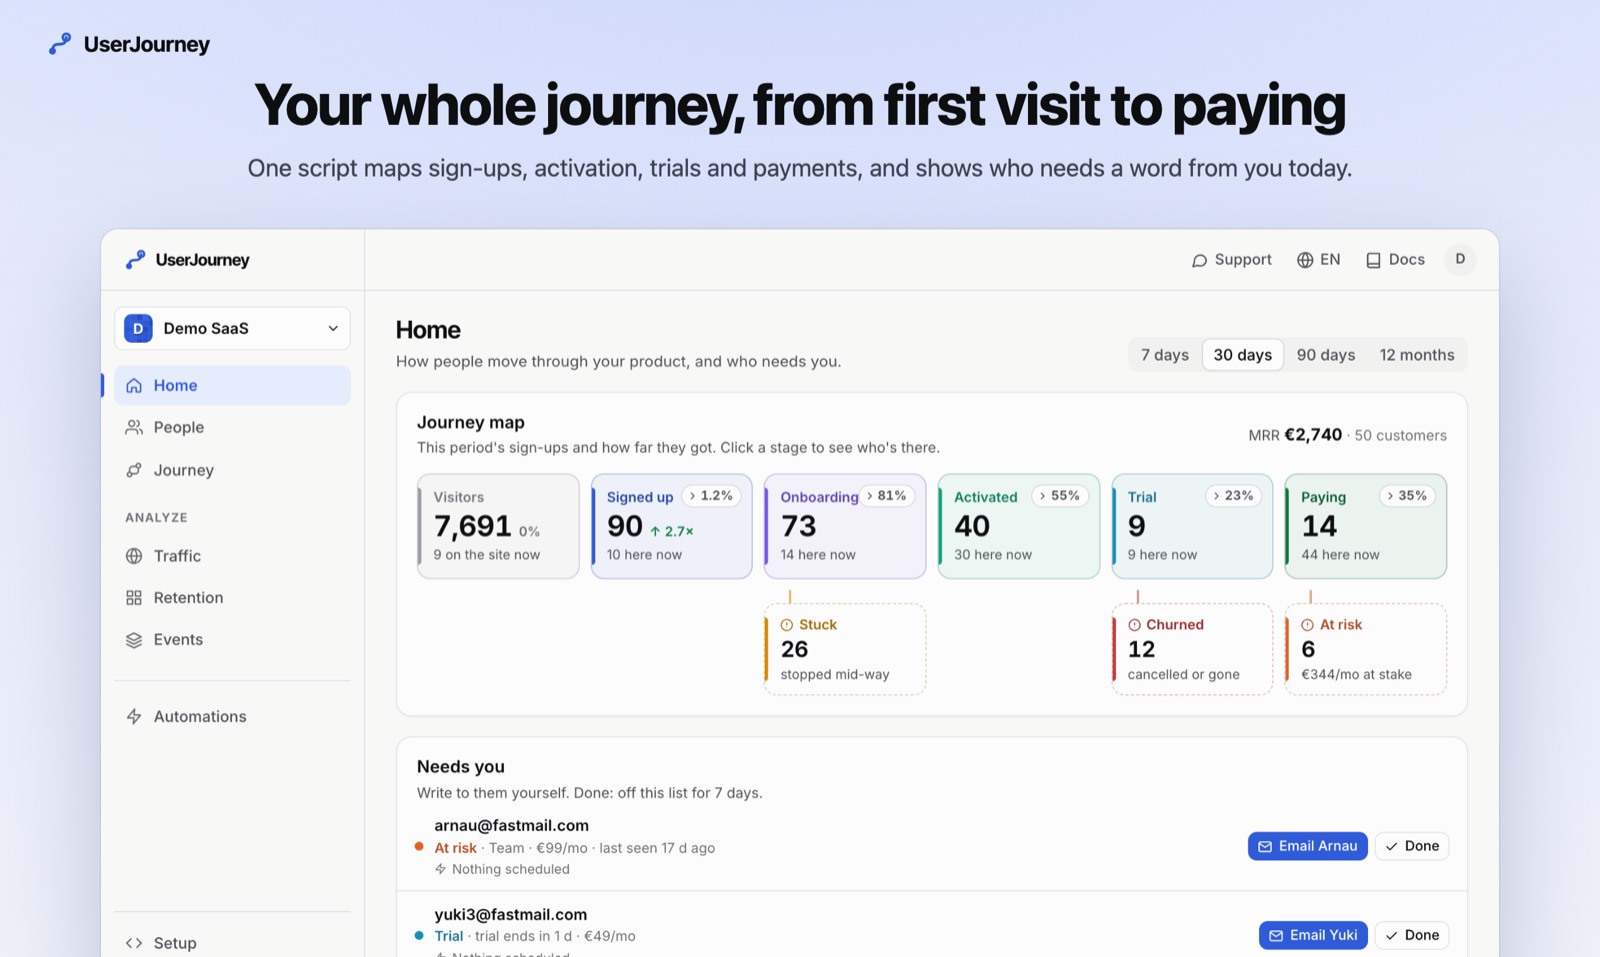
1. UserJourney: the journey from the first visit to paying
Best for: a founder or a small team who wants to know this week who's stuck, which channel pays and who's about to leave, without building anything.
One script, one identify() once someone signs in, and your payment provider. From there it works out the rest: where each visitor came from, the onboarding steps (read from your URLs), who's stuck and at which step, the paths of the people who activate, retention by sign-up week, and who's at risk among the ones who pay. Today puts the few things worth your time first, with the people behind each one and a note already written.
- Payments: Stripe and Paddle, connected in one click, per person and per channel.
- Privacy: visitors are counted without cookies, so no banner is needed for them.
- Bring them back: recovery emails written for the step each person stopped at, and in-app cards.
- Price: free up to 250 signed-up users; 19 € a month up to 2,500. Anonymous visitors are free and unlimited, so a viral post doesn't move your bill.
- Not for: session replay, heatmaps or feature flags. If you need those, pair it with one of the tools below.
Start for free · Install in Next.js, Rails, Laravel and more
2. PostHog: an all-in-one toolbox
Best for: engineering-led teams who want product analytics, session replay, feature flags, experiments and a data warehouse in one place.
PostHog autocaptures clicks and page views and gives you insights, funnels and dashboards to build. Revenue analytics from Stripe is in beta, through its data warehouse. It's billed per product: analytics is free up to 1 million events a month, then per event. It keeps a first-party cookie by default, which can be configured down.
Watch out for: time. It answers the questions you set it up to ask, so the first useful funnel is work you do. UserJourney vs PostHog
3. Mixpanel: event analytics for a planned product
Best for: product teams who keep a tracking plan and want to slice their own events every way.
Fast, flexible reports on funnels, flows, retention and cohorts, with session replay and feature flags on the plans. Free up to 1 million events a month; Growth is billed by events. Revenue comes as events you send, or from Stripe through a webhook function or a partner.
Watch out for: the tracking plan. Mixpanel is only as good as the events you decide to send and keep sending. UserJourney vs Mixpanel
4. Amplitude: a platform for product and data teams
Best for: growing companies with product and data people who explore behaviour in depth and run experiments.
Product analytics, experiments, session replay, and in-app guides and surveys as a paid add-on. Free up to 2 million events a month; Plus starts at $0 and scales with events, Growth and Enterprise are priced by sales. A Stripe source is in beta and only sees events from the day you connect it.
Watch out for: the setup a platform needs to pay off. Without a data team, much of it goes unused. UserJourney vs Amplitude
5. Plausible: cookieless web analytics
Best for: blogs and marketing sites that want clean traffic numbers with no cookies and nothing about individual people.
Light, fast and easy to share. From $9 a month by pageviews, with a 30-day trial. Funnels and revenue attribution are on the Business plan.
Watch out for: what happens after the visit. Plausible doesn't follow individual users by design, so it can't tell you who signed up from where, who's stuck or who pays. UserJourney vs Plausible
6. Google Analytics: traffic and ads
Best for: marketing sites that run Google Ads and want visits tied to campaigns and Search Console.
Free at any traffic. Funnels and paths are explorations you build. Its terms don't allow personal data such as emails, so you see ids rather than your users, and in the EU its cookies need consent.
Watch out for: the gap between a session and a customer. It counts traffic well and people poorly. UserJourney vs Google Analytics
How to choose, by your question
- "Which channel brings paying customers?" UserJourney: every sign-up is credited to the visit that brought it and followed to the payment. How it works
- "Where do new users get stuck?" UserJourney for the answer on day one; PostHog, Mixpanel or Amplitude if you'd rather build the funnel yourself. The method
- "Why did that user give up?" A session replay in PostHog, or each person's visits page by page in UserJourney.
- "How's my blog doing?" Plausible or Google Analytics.
- "Did my new pricing page work?" UserJourney's Changes compare the same days before and after, up to the payment.
Using two tools is normal
Many teams keep one tool for what it's best at and add another next to it: Google Analytics or Plausible on the marketing site, PostHog for replays and flags, UserJourney for the journey from the first visit to paying. They're all a script in your <head> and don't get in each other's way.
See every feature, tool by tool, in the side-by-side table, or start for free: it's live in five minutes.
More guides
Which marketing channel brings paying customers, not just visits
Visits per channel are easy to count and easy to misread. How to follow each channel to sign-ups, activation and revenue, and the traps attribution sets for a small SaaS.
3 min readActivationHow to find where users drop off in your SaaS onboarding
Where new sign-ups stop before they get any value: how to write your onboarding as steps, measure each one, tell a drop-off from a slow start, and what to fix first.
4 min read